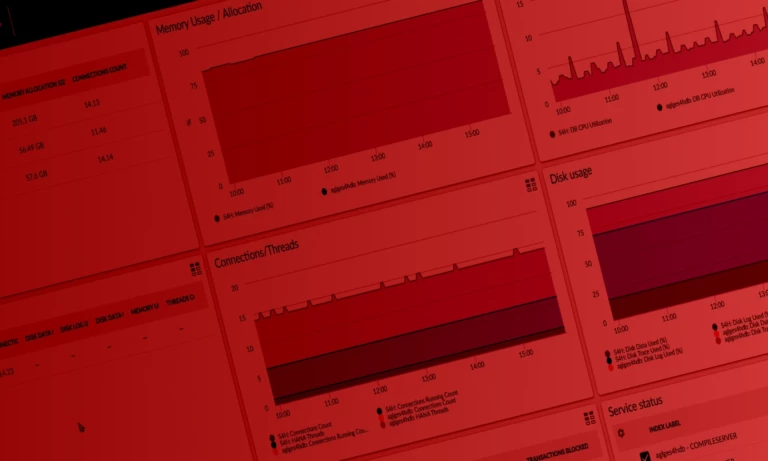
A SAP landscape that spans three cloud environments comes with three status pages, three network monitoring consoles, three SLA documents, and no view that covers what happens to a business process as it crosses all three. The multi-cloud SAP landscape is not unusual in enterprise IT today. The monitoring gap it creates is equally common and consistently underestimated at architecture time.
This article covers the specific visibility problems that emerge when SAP components run across multiple cloud providers or across a combination of cloud and on-premise infrastructure, the architectural patterns that make those problems worse, and the design decisions that make end-to-end visibility achievable without requiring a complete infrastructure overhaul.
What multi-cloud SAP looks like in a typical enterprise
The term "multi-cloud SAP" describes several distinct configurations that create different monitoring challenges. The most common is a hybrid of on-premise and cloud: ECC or S/4HANA running on-premise or in a customer-managed IaaS environment, with SAP BTP extensions hosted on BTP's underlying hyperscaler, which may be Azure, AWS, or GCP depending on the region and the account configuration. A second common configuration is RISE with SAP for the S/4HANA core, with BTP-hosted Integration Suite connecting to third-party cloud services running on a different provider.
In practice, most organizations do not make an explicit multi-cloud choice. They accumulate cloud presence across providers as different projects make different decisions: one team selects Azure for its SAP BTP integration because the enterprise has an Azure agreement, another team deploys a logistics SaaS that runs on AWS, a BusinessObjects environment migrated to a GCP-hosted VM years ago. The architectural patterns for hybrid SAP landscapes describe how to design these configurations intentionally. The visibility problem addressed here is what happens when the configuration exists and the monitoring has not been designed to match it.
The visibility gap that multi-cloud creates
Three monitoring planes with no correlation layer
Each cloud provider includes native monitoring tools that cover their own infrastructure and services. Azure Monitor covers Azure-hosted resources. AWS CloudWatch covers AWS resources. SAP BTP Cockpit covers BTP services and Integration Suite flows. Each of these tools produces accurate data about its own domain. None of them has visibility into the others.
The consequence is that a business process failure that crosses multiple cloud boundaries produces separate, unconnected event records in each monitoring plane. A sales order created in S/4HANA on Azure fails to trigger a logistics notification because Integration Suite on BTP encountered a transformation error, which caused the outbound IDoc to the logistics provider on AWS to never be generated. Azure Monitor shows the S/4HANA instance is healthy. BTP Cockpit shows the Integration Suite flow execution error. AWS shows nothing because the message never arrived. Three separate observations with no automated correlation.
The investigation that follows requires manually correlating timestamps across three platforms, identifying which flow execution in BTP corresponds to which S/4HANA transaction, and determining whether the AWS-side absence is cause or consequence. Without a correlation ID that travels with the business transaction from origin to destination, that correlation is detective work rather than a dashboard lookup. End-to-end SAP observability addresses this layer specifically: the unified view that crosses infrastructure boundaries and connects technical events to business process outcomes.
Network latency as a new SAP performance variable
On-premise SAP architectures operate with network latency between the application server and HANA that is typically under one millisecond. The same components in a cloud environment, even within the same availability zone, experience latency in the 1 to 3 millisecond range. Across availability zones in the same region, latency typically runs 2 to 5 milliseconds. Across cloud providers or across regions, latency for synchronous calls can reach 20 to 50 milliseconds per hop.
This becomes a performance problem when a business process makes multiple synchronous cross-cloud calls in sequence. A sales order process that calls S/4HANA for pricing determination, Integration Suite for tax calculation, and a third-party contract management service for terms verification accumulates the latency of each hop. At 30 milliseconds per hop, three synchronous calls add 90 milliseconds to the transaction response time before any processing begins. That overhead is invisible in any single component's monitoring and only appears in end-to-end response time measurements.
The monitoring design implication is that response time measurement in a multi-cloud SAP landscape needs to happen at the business process level, not at the component level. A component that processes its own work in 200 milliseconds is performing correctly. A business process that takes 4 seconds because it makes 12 synchronous cross-cloud calls, each adding 30 milliseconds, has an architectural problem that only appears in end-to-end timing data.
Cloud-specific failure modes that SAP teams have not dealt with before
Availability zone failures and partial degradation
On-premise infrastructure fails in ways that are typically binary: a server is up or it is down, a network link is connected or it is not. Cloud availability zone failures are more nuanced. An AZ can experience partial degradation: elevated API error rates rather than complete unavailability, increased storage I/O latency rather than disk failure, intermittent network packet loss rather than full connectivity loss. A SAP system running in a degraded AZ may remain technically reachable while delivering intermittently elevated response times and occasional transaction failures.
This failure mode is difficult to detect with standard SAP monitoring because the symptoms are scattered: some transactions slow, some succeed, some fail. There is no clear system-level event to point to. The correlation that identifies the root cause requires correlating the scattered transaction failures with cloud provider availability data for the affected AZ, which is external data not available in SAP monitoring tools.
Cloud storage I/O variance and HANA implications
SAP HANA is sensitive to storage I/O latency in ways that on-premise storage, backed by dedicated storage arrays, rarely exposes in practice. Cloud block storage introduces I/O latency variance: the same write operation that completes in 1 millisecond 99% of the time may take 15 milliseconds during a storage backend maintenance operation or during peak utilization of the underlying storage infrastructure.
These latency spikes affect HANA savepoint duration, log backup performance, and delta merge completion times. Monitoring that tracks these metrics continuously, available through the SAP HANA database monitoring layer, surfaces cloud storage variance as an operational signal. The deviation from baseline savepoint duration is often the first indicator of cloud storage degradation, appearing before the cloud provider's own status page acknowledges any issue.
| Note: Cloud provider status pages reflect infrastructure-level events that affect availability. They do not reflect the performance degradation below the availability threshold that affects SAP workloads. A SAP system running on storage experiencing 3x normal I/O latency will not appear on a cloud provider status page. It will appear in HANA savepoint duration metrics and, if the degradation is sustained, in dialog response time trends. |
RISE with SAP and the monitoring boundary it creates
RISE with SAP bundles S/4HANA hosting, infrastructure management, and platform operations into a single SAP-managed subscription. SAP manages the infrastructure layer, HANA cluster configuration, and base platform availability. The customer retains responsibility for application configuration, custom extensions, integrations, and observability at the application layer.
The monitoring boundary this creates is specific: SAP's RISE SLA covers infrastructure availability and platform health. Application-layer metrics, business process completion rates, background job success rates, interface error rates, and HANA application performance are customer responsibility. An organization running on RISE that relies only on SAP's built-in monitoring has application-layer blind spots by design.
The practical gap appears most clearly when a business process fails on a RISE-hosted system. SAP's monitoring confirms the infrastructure is healthy. The application-layer investigation falls to the customer, who needs an independent monitoring connection to the S/4HANA application layer to determine root cause. Establishing that connection is straightforward using standard RFC or REST APIs, but it requires explicit setup and authorization that many RISE customers have not implemented. The agentless monitoring architecture is particularly relevant here: it requires no infrastructure access to the RISE platform, only a dedicated application-layer monitoring user.
Architectural fixes for multi-cloud SAP visibility
Unified monitoring plane with cross-cloud data collection
A unified monitoring plane collects data from SAP application layer, cloud infrastructure metrics, and middleware observability into a single platform with a common time axis. The SAP application data comes from RFC-based and HANA SQL collection, as described in SAP agentless monitoring architecture. Cloud infrastructure metrics from each provider's API supplement the application data with AZ health, storage I/O latency, and network performance. The result is a single view where an AZ degradation event and simultaneous SAP performance anomaly appear on the same timeline rather than in separate platforms.
This unified collection does not require a single monitoring tool to replace all existing cloud monitoring. It requires a monitoring platform capable of ingesting data from multiple sources and correlating it by time and by business context. The SAP-specific data, which is not available from cloud provider monitoring tools, is the layer that only a SAP-aware monitoring connection can provide.
Cross-cloud transaction correlation
Business process correlation IDs that travel from origin system through integration middleware to all downstream systems are the mechanism that makes cross-cloud root cause analysis tractable. Without a shared identifier, correlating a S/4HANA transaction with the BTP Integration Suite flow it triggered and the downstream system that received the result requires timestamp alignment and manual reconstruction. With a correlation ID embedded in each transaction payload and logged at each processing step, the investigation is a single search across all monitoring platforms. The SAP integration hub monitoring covers the integration layer design that makes correlation ID propagation consistent rather than system-by-system.
Synthetic business process probing
Synthetic monitoring executes lightweight test transactions on a schedule and measures the end-to-end result. A synthetic probe that creates a test sales order in S/4HANA, verifies that Integration Suite processed the associated outbound message, and confirms that the downstream system received it tests the full business process path every few minutes. If any step in the chain fails or exceeds the expected completion time, the probe fires an alert before any real user transaction experiences the problem.
Synthetic probing is the monitoring approach that most directly reflects business process health rather than component health. A probe that succeeds confirms the end-to-end path is working. A probe that fails identifies exactly which step failed and in which cloud. It does not replace component-level monitoring, but it provides the first-line signal that triggers deeper investigation and reduces the detective work required to locate the failure in a multi-cloud chain.
Multi-cloud SAP visibility is an architectural problem before it is a tooling problem. A landscape where components run across three clouds with no correlation layer, no shared transaction identifiers, and no end-to-end business process monitoring will not become visible by adding another monitoring dashboard. The architectural decisions that determine visibility, how correlation IDs are propagated, where the unified monitoring collection runs, and which business processes have synthetic probes, are made during design and are difficult to retrofit.
The starting point for teams inheriting a multi-cloud SAP landscape without designed-in visibility is a monitoring gap assessment: which components are monitored, which are not, and which business processes have no end-to-end visibility. The free SAP monitoring assessment is one structured approach to that starting point. The fixes are incremental, but the assessment determines where to begin.
Redpeaks collects SAP application-layer metrics across RISE with SAP, customer-managed cloud, and on-premise environments through a single agentless connection, with cross-system correlation views and integration layer monitoring for multi-cloud business process visibility. See the multi-cloud monitoring coverage.