
SAP Monitoring & Observability Features for Enterprise SAP Landscapes
Be more productive, reduce operational costs and risks, automate and simplify workflows. Just like that.
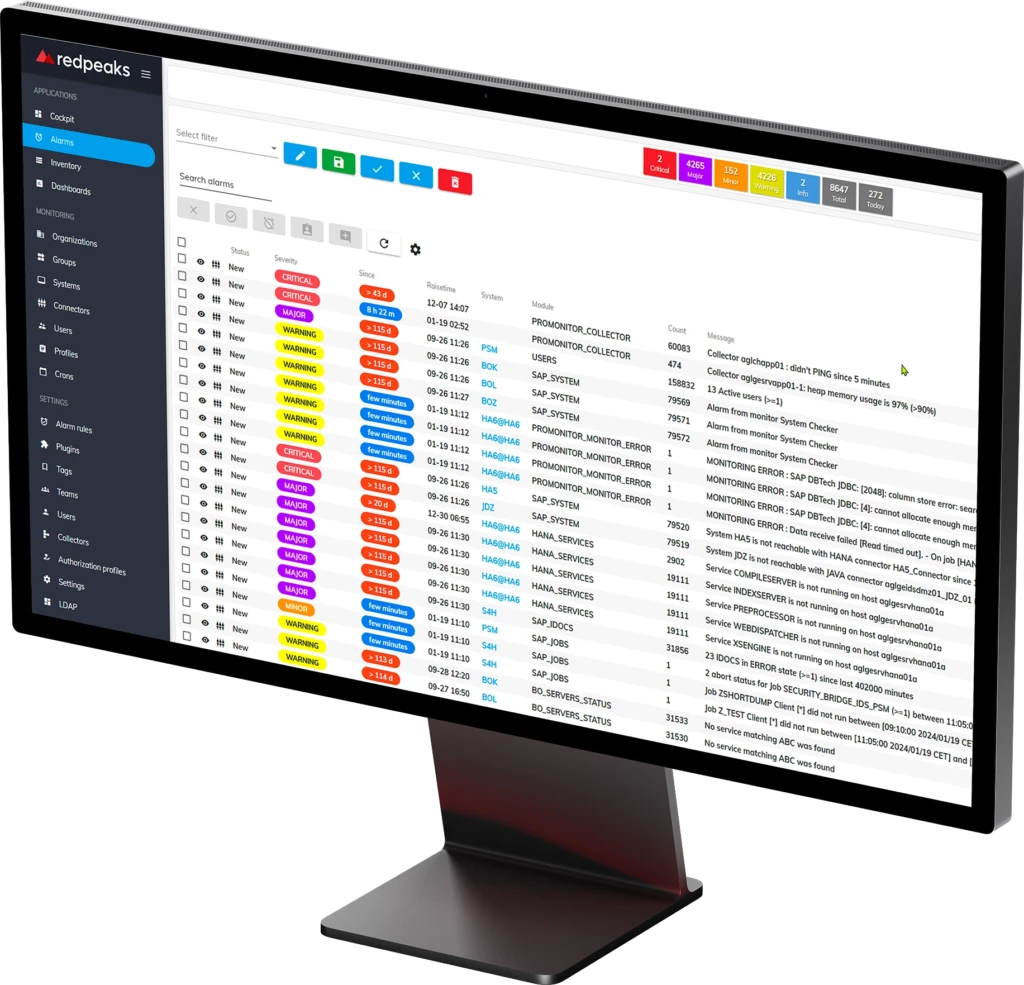
Smart features for smarter monitoring
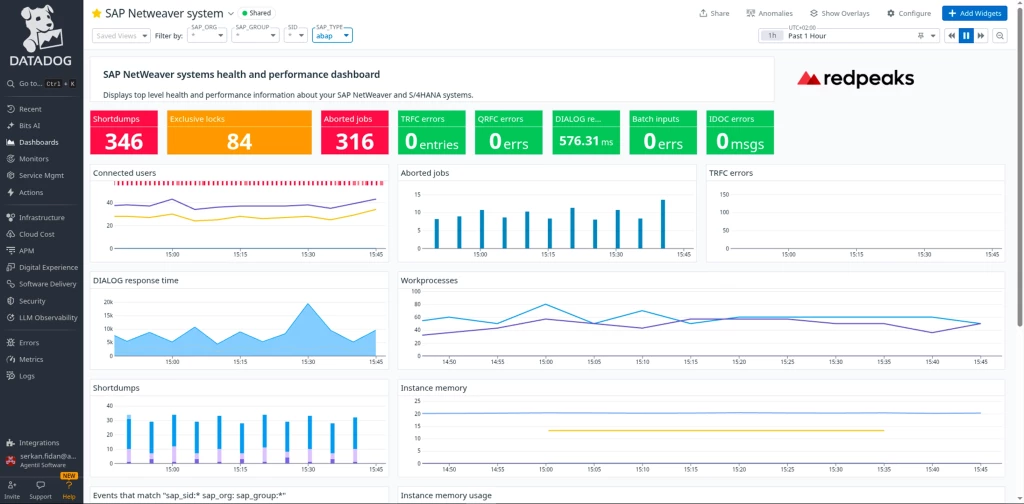
Discover Redpeaks’ 80+ Out-of-the-Box Metrics & Alerts: core SAP monitoring components, including NetWeaver, HANA, custom REST endpoints, and SAP jobs, are pre-instrumented and ready.

- Goes beyond tech metrics—provides context such as:
- Which business unit or critical report failed
- SLA compliance for scheduled reports
- Which data sources are slowing report delivery

RedPeaks’ SAP Monitoring Tool delivers significant value to its clients by enhancing the performance, stability, and reliability of their SAP environments.
Preventing your SAP landscapes to slow down or even break down has never been so simple to setup and manage.


- Automatically create tickets based on alert severity or predefined rules.
- Include detailed SAP context (system name, error logs, transaction info).
- Track issue lifecycle from detection to resolution.
- ServiceNow
- BMC Remedy
- Jira Service Management
- Zendesk
- Successfully deployed in RISE with SAP, public cloud, hybrid, and on-prem models
- Used by MSPs, large SAP CoEs, and Fortune 500 firms

RISE with SAP is a managed, subscription-based offering that includes S/4HANA Cloud (public or private edition), SAP BTP, and infrastructure management (typically on hyperscalers like AWS, Azure, or GCP).


Are you currently looking for a SAP Observability and Intelligent Operations solution?
Monitored technologies
Comprehensive coverage of SAP and supporting ecosystem components, enabling end-to-end visibility across IT landscapes.
Redpeaks offers Key Benefits combined with your ITSM environment as well:
- Automatically create tickets based on alert severity or predefined rules.
- Include detailed SAP context (system name, error logs, transaction info).
- Track issue lifecycle from detection to resolution.

Supports RISE without any specific agent or intrusive SAP transport, connect to your SAP instance with a simple user access.

Provides significant value in SAP S/4HANA migration projects, with proactive monitoring and intelligent observability capabilities.

Simple Agentless Architecture: deploy without agents or transports on any SAP ECC 6.0 system landscapes.

Deep & Native BOBJ Monitoring for SAP BusinessObjects mission-critical support, especially across large user bases or time-sensitive SLAs.

Deep database insights, including slow queries, DB growth trends, connection issues, and backup/restore status.

Deep specific real-time monitoring for SAP HANA database, during migration or after go-live using native SQL HANA API's.

Successfully deployed in RISE with SAP, public cloud, hybrid, and on-prem models, including SAP Cloud and BTP technologies.
Available to Redpeaks customers, this seamless integration with SAP ALM enriches lifecycle management with advanced observability capabilities.

Power up your monitoring with Plugins
We offer multiple integration plugins to connect Redpeaks Monitoring to third party environments.
Monitoring information generated by Redpeaks can also be propagated via via API or emails.
Therefore, if you need a custom plugin, feel free to contact us, we will collaborate with you to make it available.
Anticipating the occurence of problems in the SAP environment of a pharmaceutical company
A global pharmaceutical company specializing in vaccines, with 13,000 SAP users handling up to 1.5 million daily transactions, is dedicated to improving human life through innovative medicines, vaccines, and healthcare products.
Discover how Redpeaks is essential in managing their SAP environment.
“With Redpeaks, the IT team can monitor SAP events to assess performance and response times across the entire IT infrastructure.”
- Senior Manager of IT Operations
SAP Observability FAQ
SAP observability goes far beyond checking whether your systems are up and running.
This FAQ answers the most common questions SAP teams ask about monitoring performance, detecting incidents early, tracking critical SAP metrics, and gaining better visibility across complex SAP environments.
What is SAP observability?
SAP observability is the ability to understand the health, performance and behavior of an SAP landscape by analyzing data across infrastructure, databases, SAP applications, interfaces and business processes. It goes beyond checking whether individual systems are simply “up” or “down”.
Effective SAP observability combines signals such as SAP dialog response times, work process utilization, HANA performance, background jobs, IDoc processing, RFC queues, system logs and business-critical workflows. This gives SAP Basis and operations teams the context they need to identify abnormal behavior, understand root causes and detect issues before they affect users.
Redpeaks provides centralized SAP observability across environments including SAP S/4HANA, NetWeaver, HANA and BusinessObjects, with real-time monitoring, dashboards and alerting.
What should SAP teams monitor beyond CPU and memory?
SAP teams should monitor application performance, work processes, interfaces, background jobs, databases and business processes in addition to infrastructure metrics such as CPU and memory.
Important SAP-specific signals include:
- Dialog response times and their processing, database, wait and RFC components
- Dialog, background, update and spool work process utilization
- ABAP extended memory and SAP buffer performance
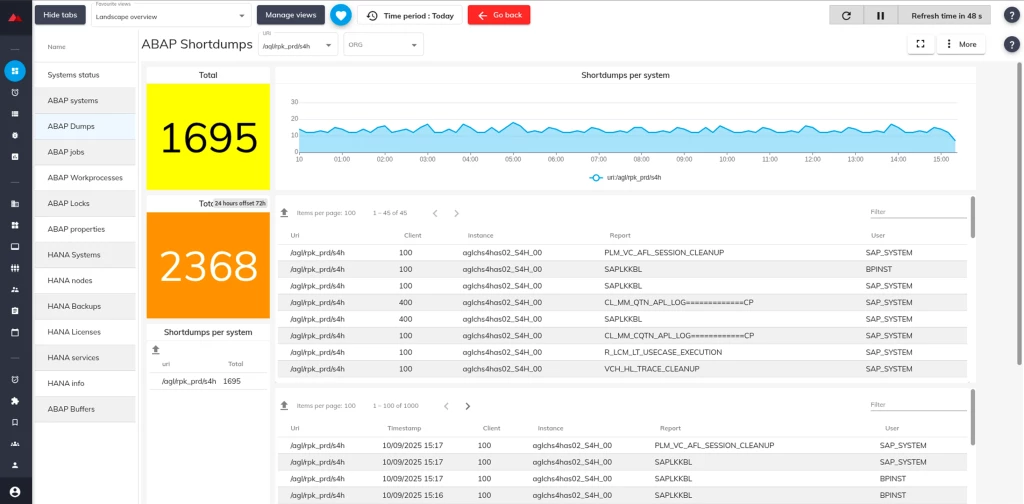
- Short dumps, system logs, update errors and locks
- HANA memory, log volume, backups, expensive queries and database health
- IDoc errors, waiting messages, RFC/qRFC queues and interface latency
- Background job failures, runtimes, delays and missed executions
- SAP transaction response times and instance availability
- Business-critical report and process execution
A server can have normal CPU and memory while users still experience slow transactions, blocked work processes or delayed interfaces. Monitoring the SAP application layer is therefore essential for understanding actual service quality.
How do you detect SAP incidents before users complain?
SAP incidents can be detected before users complain by monitoring early warning signals and trends instead of waiting for hard errors or outages.
Examples include a gradual increase in dialog response time, rising work process utilization, growing IDoc or qRFC queues, background jobs taking longer than normal, HANA memory trending toward its limit, increasing interface latency or a scheduled process that fails to execute at its expected time.
The key is to establish what “normal” looks like for each SAP system and alert when behavior deviates from that baseline. Time-aware thresholds are often more effective than universal static thresholds because normal SAP workloads change between business hours, overnight batch windows and month-end processing.
Redpeaks continuously collects SAP-specific metrics and can trigger alerts when conditions indicate degradation, helping teams move from reactive troubleshooting toward proactive SAP operations.
What metrics should an SAP Basis team monitor?
An SAP Basis team should monitor metrics across the SAP application, database, interface and infrastructure layers rather than relying on a small set of server-level KPIs.
At the SAP application level, teams should track dialog response times, work process utilization, dispatcher queues, ABAP memory, buffer hit ratios, short dumps, locks, update requests, system logs and application server availability.
For SAP operations, they should also monitor background job status, duration, start delay and occurrence; IDoc errors and waiting messages; RFC and qRFC queues; SAP transaction execution times; spool activity and SAPconnect.
For SAP HANA environments, monitoring should additionally cover database memory, disk and log volume usage, backups, services, connections, expensive statements and replication health.
The right thresholds depend on each system’s normal workload, criticality and service-level objectives.
What causes SAP IDoc delays?
SAP IDoc delays are commonly caused by processing backlogs, unavailable receiving systems, insufficient processing capacity, blocked queues, slow application processing or configuration and data errors.
For example, outbound IDocs can remain in status 02 or 12 when an EDI or receiving subsystem is not processing messages. Inbound IDocs can accumulate in status 64 when SAP receives messages faster than available processes can post them. This can happen when background work processes are busy, the inbound processing program becomes slow or an earlier message blocks subsequent processing.
Status 51 typically indicates an application posting error, often related to master data, authorization or configuration issues.
SAP teams should therefore monitor not only IDoc errors but also message age, queue growth, waiting states and throughput by message type. Redpeaks can monitor ERROR and WAITING IDocs using rules based on SAP client, message type, partner and direction.
How should SAP background jobs be monitored?
SAP background jobs should be monitored for status, runtime, start delay and expected occurrence, not simply for whether they eventually finish.
A business-critical job can technically finish successfully while still creating an operational problem because it ran too late, took significantly longer than normal or produced incorrect output. Likewise, a scheduled job that never starts may not generate the same obvious failure signal as an aborted job.
SAP teams should therefore monitor:
- Aborted or cancelled jobs
- Runtime compared with expected or historical duration
- Delayed start times
- Missing job executions
- Expected schedules and calendars
- Dependencies between critical jobs
- Spool or application output for high-value processes
Redpeaks’ SAP Jobs monitor specifically tracks job error status, duration, delay and occurrence, with configurable rules and alert severity for individual jobs.
How do you monitor SAP BusinessObjects?
SAP BusinessObjects monitoring should cover report delivery, BusinessObjects services, scheduled jobs, data-source connectivity and user experience rather than simply checking whether BusinessObjects servers are running.
Key areas include the Central Management Server (CMS), Adaptive Processing Server, Adaptive Job Server, Web Intelligence processing services, File Repository Servers and Connection Server.
SAP BusinessObjects teams should monitor service availability and resource consumption, job queue depth, scheduled report execution, failed or missing reports, report rendering times, database connection errors, concurrent sessions and license utilization.
For business-critical reports, monitoring should also verify whether expected output was actually produced. A BusinessObjects job can report “Success” even when the resulting report contains no meaningful data.
Redpeaks provides agentless BusinessObjects monitoring covering areas such as service availability, job instance success rates, rendering-time trends and license utilization alongside the wider SAP landscape.
What is the difference between SAP monitoring and SAP observability?
SAP monitoring tells teams when a known metric or component is outside its expected state, while SAP observability provides the broader context needed to understand why the problem is happening and how it affects the SAP landscape or business process.
Traditional SAP monitoring might alert that a work process pool is saturated, an IDoc has failed or HANA memory has crossed a threshold.
SAP observability connects these signals. For example, an increase in dialog response time may correlate with work process saturation, a slow RFC dependency and a growing interface queue. Looking at those signals together makes root-cause analysis much faster than investigating individual alarms independently.
Observability also extends monitoring beyond technical availability toward trends, dependencies, user experience and business outcomes.
Redpeaks combines SAP-specific monitoring data into centralized dashboards, metrics and alerts across SAP applications, databases, integrations and business processes, helping teams understand both what is happening and where to investigate next.